Available with Location Referencing license.
Route and Measure method
Characteristics of a route such as operating pressure and DOT class can be represented as a linear event with starting and ending measure information along the route. The Line Events tool provides an interface to add linear events into the geodatabase. You can also use referent offset data to add events to a route. The referent offset data is translated to routes and measures for storage.
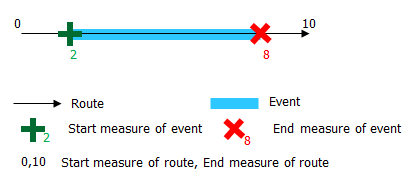
In this method, the event's from measure and to measure are located on the basis of the measure values from the selected route. As shown in the example below, the from and to measures of the route are 0 and 10, respectively. An event with from and to measures of 2 and 8 can be located on the route. The route and measure method is always the first option (in the form of the network's name) in the Method drop-down list.
- Open Event Editor and, if prompted, sign in to your ArcGIS organization.
- Click the Edit tab.
- In the Edit Events group, click the Line Events button
 .
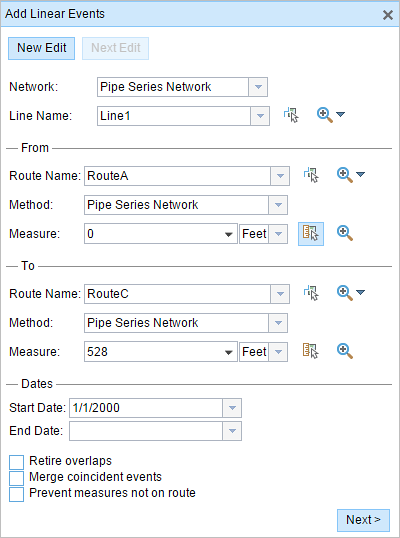
.The Add Linear Events dialog box appears.
Note:
The selections in steps 3, 5, and 8 can be configured in advance when configuring, creating, or editing the default settings for attribute sets. For more information about configuring, creating, and editing default settings for attribute sets, see Producing attribute sets and Configuring attribute sets.
- Click the Network drop-down arrow and choose the network that will serve as a source linear referencing method (LRM) for defining the input measures for the new linear events.
The network is an LRS Network published as a layer in Event Editor. You can specify the LRS Network to be used as the LRM for defining the start and end measures of the new linear event. Event Editor also accepts measures in a network or LRM that is not associated with the linear event layer.
The new event will be associated with the routes (route IDs) from the LRS Network with which the event location intersects.
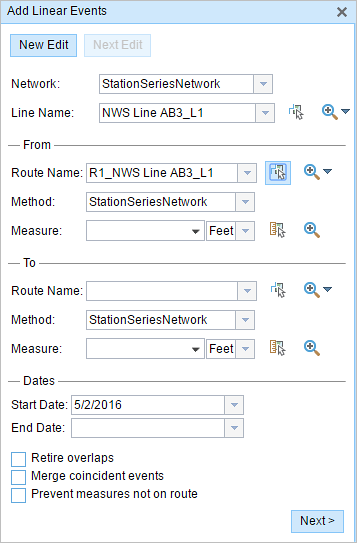
- Specify the name of the line feature on which the events will be located by doing one of the following:
- Click the drop-down arrow to choose the line name in the Line Name text box.
- Click the Select a Line on the Map tool
 and select the line from the map.
Tip:
If the selected line is not in the active view of the map, click Zoom to the line extent or center on the line start or end point on the Map
 to refresh the map display to zoom in to the entire extent of the selected line.
The line is highlighted in light blue. The arrow at the end shows the direction of calibration of the line.
- In the From section, click the Method drop-down arrow and choose the network.
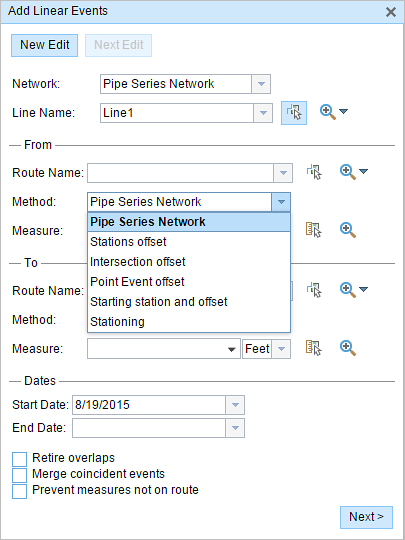
- from the Route Name drop-down list, choose the route where the event's from measure value will be located.

- Type the route's name.
- Use the Select a Route on the Map tool
 to choose the route on the map.
Only routes that are part of the chosen line can be selected.
- Provide the intended start location for the new linear event along the route using any of the following options:
- Type the value in the Measure text box.
- Use the Select from Measure on the Map tool
 to choose the from measure value along the route on the map.
 - Use the Measure drop-down arrow to choose either Use the Route Start or Use the Route End as the from measure value for the event.
If you type the from measure value, you can choose the unit for that value using the drop-down arrow. The from measure value is converted to LRS units before saving the newly added events. For example, the LRS is in miles and you typed 528 feet as the from measure value. The newly added events will have a from measure value of 0.1 miles, because 528 feet equals 0.1 miles.
A green plus symbol appears at the selected location on the map.
- For the to measure value, repeat steps 6 through 8 in the to section.
A red cross symbol appears at the selected location on the map.
- Choose the date that will define the start date of the events by doing one of the following:
- Provide the start date in the Start Date text box.
- Click the Start Date drop-down arrow and choose the start date.
The start date default value is the current date, but you can choose a different date using the date picker.
- Choose the date that will define the end date of the events by doing one of the following:
- Provide the end date in the End Date text box.
- Click the End Date drop-down arrow and choose the end date.
The end date is optional, and if it is not provided, the event remains valid now and into the future.
- Choose from the following data validation options to prevent erroneous input while characterizing a route with linear events:
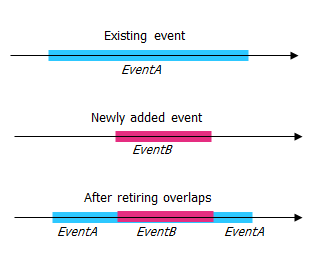
- Retire overlaps—The system adjusts the measure and start and end dates of existing events so that the new event does not cause
an overlap with respect to time and measure values.
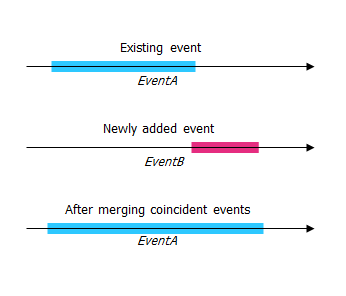
- Merge coincident events—When all attribute values for a new event are exactly the same as an existing event, and if the new event is adjacent to or overlapping the existing event in terms of measure values, the new event is merged into the existing event and the measure range is expanded accordingly.
- Prevent measures not on route—The input measure values for the starting measure and ending measure values fall in the minimum and maximum range of measure values on the selected route.
- Retire overlaps—The system adjusts the measure and start and end dates of existing events so that the new event does not cause
an overlap with respect to time and measure values.
- Click Next.
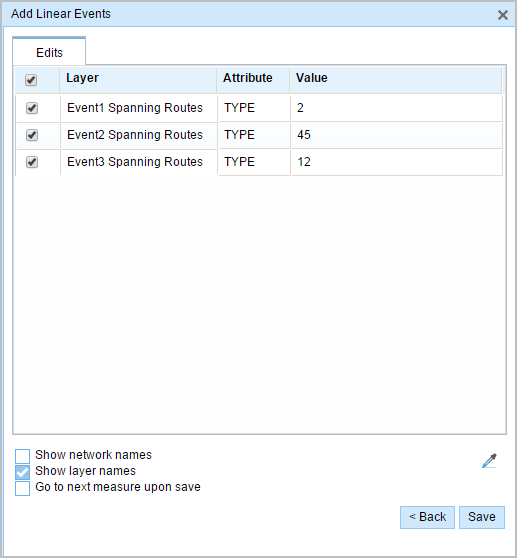
The tab showing the attribute set for the events appears.
Note:
You can use the check boxes to add data for specific events in the attribute set. No records are added for events that are not checked.
- Provide the attribute information for the new event in the tables defined by attribute sets.
You can use the Copy Attribute Values tool
 to copy event attributes from another route. Click the tool and click a route on the map to copy the event attributes.
Event Editor uses a default attribute set, as shown on the Edit tab. You can modify the attribute set to create custom attribute sets or use the administrator-configured attribute set.
- Use the following options to access more information on the attribute set:
- Check the Show network name check box to show the LRS Network associated with the selected event layer.
- The list of attributes in the tables defined by attribute sets can be from more than one event layer. To identify the source event layer for each attribute, check the Show layer names check box.
- Checking the Go to the next measure upon save check box results in prepopulating the from measure value using the to measure value of the present section to continue the event creation process.
- Click Save.
The new linear events are created and appear on the map. A confirmation message appears at the lower right once the newly added line events are saved.
After a linear event has been created, you can do the following to continue characterizing the route:
- Click New Edit to clear all the input entries in the widget and restore the default values from the geodatabase to the table.
- Click Next Edit to retain all the existing entries in the widget and the attribute set for convenience and for quick editing of similar characteristics.